")
")
")
")
")
")
")
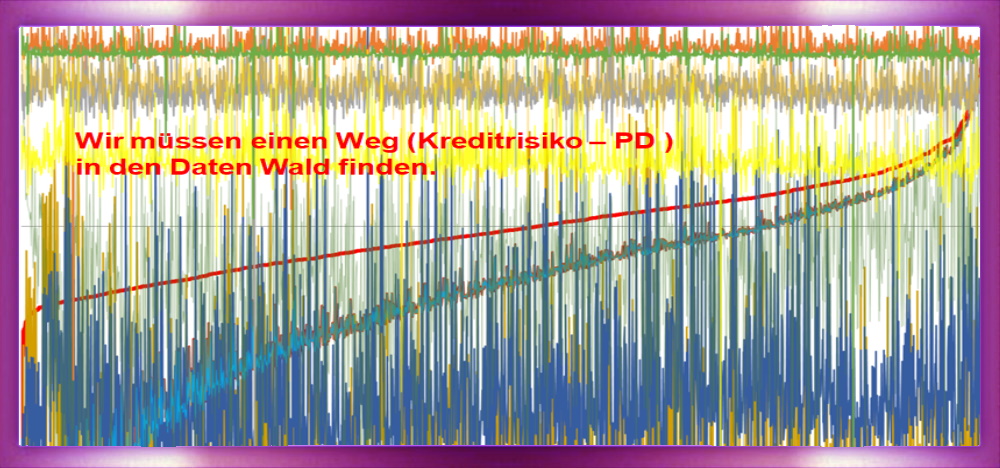
Visual representations: understand data more easily
Data is omnipresent these days and is collected and analyzed in a wide variety of areas. It can be difficult to filter out the important information from the many facts and figures and to recognize connections. This is where the importance of visual representations comes into play.
A visual representation, also called data visualization, makes it possible to bring complex amounts of data into an easily understandable form. Instead of looking at dry columns of numbers, patterns and trends can be recognized at a glance in the form of graphs and charts. This can be helpful not only for your own data analysis, but also for presenting results and communicating with others.
If you need help transforming your data into an understandable visual model, Leonardo Miljko's statistical consulting and data analysis can help. With many years of experience and expertise in this area, he can help you prepare your data and turn it into meaningful graphics and charts.
Patterns and trends that may go undetected in text-based data can be identified and, more importantly, more easily understood through visual representations. This can be particularly helpful when it comes to explaining complex relationships or making decisions based on data.
So if you want to put your data in an understandable visual form, don't hesitate to contact Leonardo Miljko. His statistical advice and data analysis can help you make the best use of your data.
keywords:
Data visualization, graphs, charts, data analysis, statistics, Leonardo Miljko
meta text:
Learn about the importance of visual representations in data analysis and how Leonardo Miljko's statistical consulting can help you transform your data into an understandable visual model.
"Used Source: ChatGPT"

